David Herron
Tags: InfluxDB »»»»
Influx DB is an easy-to-use time-series database, that uses a familiar query syntax, allows for regular and irregular time series, and is part of a broad stack of platform components. The TICK stack is a set of four components that together make it quick and easy to collect time series data and graph it for users. One uses the CLI because it's always there, and is much easier than using CURL on the REST API.
The dataset used in the example is available as so:
$ curl https://s3-us-west-1.amazonaws.com/noaa.water.database.0.9/NOAA_data.txt >NOAA_data.txt
  % Total    % Received % Xferd  Average Speed   Time    Time     Time  Current
                                 Dload  Upload   Total   Spent    Left  Speed
100 4956k  100 4956k    0     0  2490k      0  0:00:01  0:00:01 --:--:-- 2493k
InfluxDB can be easily installed using two Docker commands (see
https://hub.docker.com/_/influxdb/):
docker pull influxdb
docker run -p 8086:8086 -p 2003:2003 -p 8083:8083 \
      -e INFLUXDB_ADMIN_ENABLED=true \
      -e INFLUXDB_GRAPHITE_ENABLED=true \
      -v $PWD:/var/lib/influxdb \
      influxdb
The second starts a running instance of InfluxDB that's running on the terminal. The output might look like this:
 8888888           .d888 888                   8888888b.  888888b.
   888            d88P"  888                   888  "Y88b 888  "88b
   888            888    888                   888    888 888  .88P
   888   88888b.  888888 888 888  888 888  888 888    888 8888888K.
   888   888 "88b 888    888 888  888  Y8bd8P' 888    888 888  "Y88b
   888   888  888 888    888 888  888   X88K   888    888 888    888
   888   888  888 888    888 Y88b 888 .d8""8b. 888  .d88P 888   d88P
 8888888 888  888 888    888  "Y88888 888  888 8888888P"  8888888P"

[I] 2017-05-30T00:31:17Z InfluxDB starting, version 1.2.4, branch master, commit 77909d7c7826afe597b12d957996d6e16cd1afaa
[I] 2017-05-30T00:31:17Z Go version go1.7.4, GOMAXPROCS set to 2
[I] 2017-05-30T00:31:17Z Using configuration at: /etc/influxdb/influxdb.conf
[I] 2017-05-30T00:31:17Z Using data dir: /var/lib/influxdb/data service=store
[I] 2017-05-30T00:31:17Z opened service service=subscriber
[I] 2017-05-30T00:31:17Z Starting monitor system service=monitor
[I] 2017-05-30T00:31:17Z 'build' registered for diagnostics monitoring service=monitor
[I] 2017-05-30T00:31:17Z 'runtime' registered for diagnostics monitoring service=monitor
[I] 2017-05-30T00:31:17Z 'network' registered for diagnostics monitoring service=monitor
[I] 2017-05-30T00:31:17Z 'system' registered for diagnostics monitoring service=monitor
The next step is to get a help message from the influx command. According to the Docker Hub page, we have to start a second Influx container that links to the first because of some Docker limitations.
$ docker run --rm --link=quizzical_keller -it influxdb influx -host quizzical_keller -h
Usage of influx:
  -version
       Display the version and exit.
  -host 'host name'
       Host to connect to.
  -port 'port #'
       Port to connect to.
  -socket 'unix domain socket'
       Unix socket to connect to.
  -database 'database name'
       Database to connect to the server.
  -password 'password'
      Password to connect to the server.  Leaving blank will prompt for password (--password '').
  -username 'username'
       Username to connect to the server.
  -ssl
        Use https for requests.
  -unsafeSsl
        Set this when connecting to the cluster using https and not use SSL verification.
  -execute 'command'
       Execute command and quit.
  -format 'json|csv|column'
       Format specifies the format of the server responses:  json, csv, or column.
  -precision 'rfc3339|h|m|s|ms|u|ns'
       Precision specifies the format of the timestamp:  rfc3339, h, m, s, ms, u or ns.
  -consistency 'any|one|quorum|all'
       Set write consistency level: any, one, quorum, or all
  -pretty
       Turns on pretty print for the json format.
  -import
       Import a previous database export from file
  -pps
       How many points per second the import will allow.  By default it is zero and will not throttle importing.
  -path
       Path to file to import
  -compressed
       Set to true if the import file is compressed

Examples:

    # Use influx in a non-interactive mode to query the database "metrics" and pretty print json:
    $ influx -database 'metrics' -execute 'select * from cpu' -format 'json' -pretty

    # Connect to a specific database on startup and set database context:
    $ influx -database 'metrics' -host 'localhost' -port '8086'
On that command line I used quizzical_keller as the container name because that was the name autogenerated by Docker. When creating the container, I should have used the --name option to assign a more meaningful name. In any case, this shows that we can start the Influx CLI tool using that long Docker command, and passing options to the CLI tool is a simple matter of appending the desired options to the end of the command line.
$ docker run --rm --link=quizzical_keller -it influxdb influx -host quizzical_keller
Connected to http://quizzical_keller:8086 version 1.2.4
InfluxDB shell version: 1.2.4
>
>
Running the same command without options starts an interactive CLI session.
Importing the database requires a bit of subterfuge:
$ docker run --rm --link=quizzical_keller -it influxdb influx -host quizzical_keller -import -path=NOAA_data.txt -precision s
ERROR: open NOAA_data.txt: no such file or directory

$ docker run --rm --link=quizzical_keller -v `pwd`:/data -it influxdb influx -host quizzical_keller -import -path=/data/NOAA_data.txt -precision s
2017/05/30 00:50:19 Processed 1 commands
2017/05/30 00:50:19 Processed 76290 inserts
2017/05/30 00:50:19 Failed 0 inserts
The first attempt is as shown in the attached video, but it fails. Why? It fails because the file is not visible inside the Docker container.
The second attempt mounts the current directory as /data making any files visible inside the container. That lets us specify -path=/data/NOAA_data.txt, and the influx command is then able to read the file because it is visible inside the container.
The -precision s flag specifies "second" precision, matching the timestamps in the file.
$ docker run --rm --link=quizzical_keller -v `pwd`:/data -it influxdb influx -host quizzical_keller
Connected to http://quizzical_keller:8086 version 1.2.4
InfluxDB shell version: 1.2.4
>
> show databases
name: databases
name
----
_internal
NOAA_water_database
Now we quickly check we have a running database.
> use NOAA_water_database
Using database NOAA_water_database
Switch to the database.
> SELECT * FROM h2o_quality LIMIT 10
name: h2o_quality
time                index location     randtag
----                ----- --------     -------
1439856000000000000 41    coyote_creek 1
1439856000000000000 99    santa_monica 2
1439856360000000000 11    coyote_creek 3
1439856360000000000 56    santa_monica 2
1439856720000000000 38    coyote_creek 1
1439856720000000000 65    santa_monica 3
1439857080000000000 50    coyote_creek 1
1439857080000000000 57    santa_monica 3
1439857440000000000 35    coyote_creek 3
1439857440000000000 8     santa_monica 3
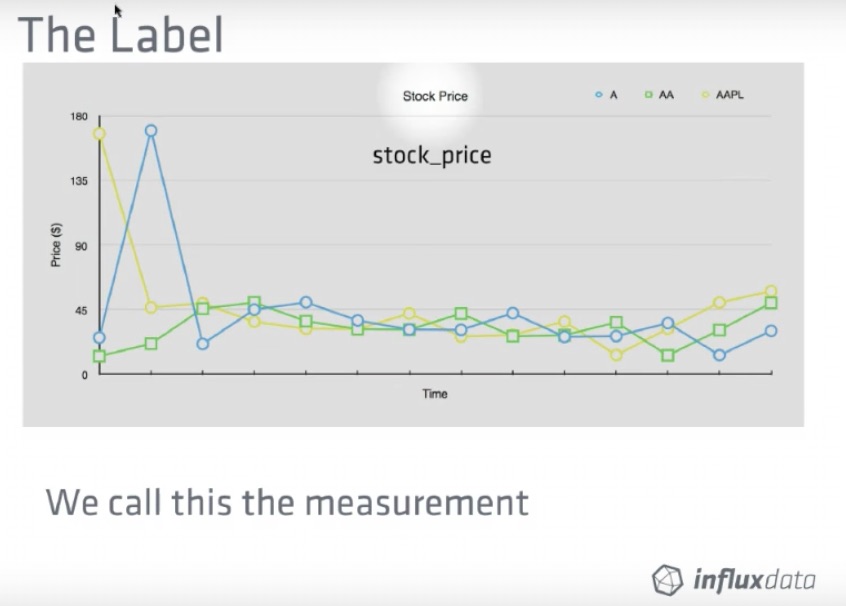
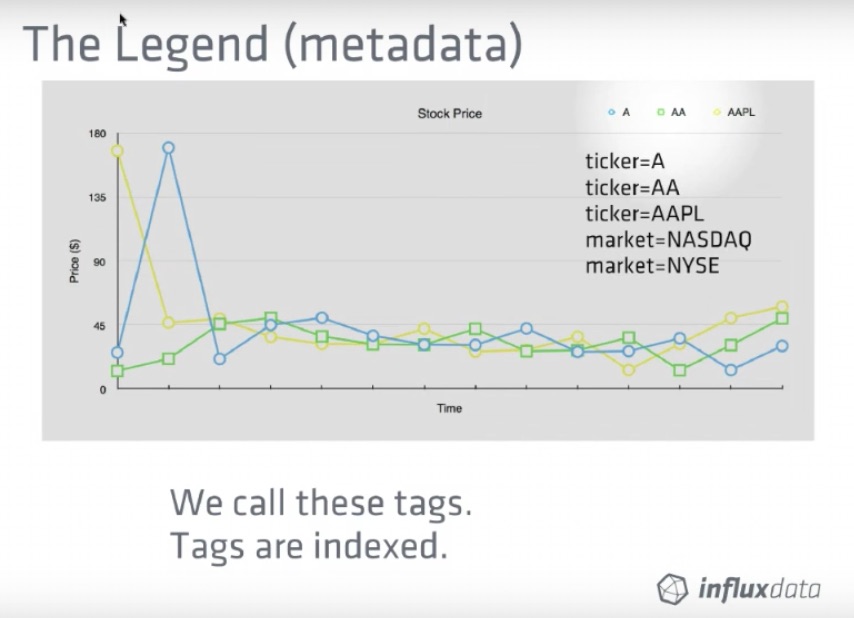
Simple query of the database. This is where they say it's a familiar query syntax, since it's kinda-sorta like SQL if you squint correctly.
This query means "give us everything under the h2o_quality measurement". In an SQL database it would mean "h2o_quality table" instead. That's a difference between the two styles.
The timestamps aren't user-friendly, of course.
The precision command lets you change the format of the timestamp:
> precision rfc3339
> SELECT * FROM h2o_quality LIMIT 10
name: h2o_quality
time                 index location     randtag
----                 ----- --------     -------
2015-08-18T00:00:00Z 41    coyote_creek 1
2015-08-18T00:00:00Z 99    santa_monica 2
2015-08-18T00:06:00Z 11    coyote_creek 3
2015-08-18T00:06:00Z 56    santa_monica 2
2015-08-18T00:12:00Z 38    coyote_creek 1
2015-08-18T00:12:00Z 65    santa_monica 3
2015-08-18T00:18:00Z 50    coyote_creek 1
2015-08-18T00:18:00Z 57    santa_monica 3
2015-08-18T00:24:00Z 35    coyote_creek 3
2015-08-18T00:24:00Z 8     santa_monica 3
RFC3339 is where time formats are defined. This is more humanly readable.
> format json
> SELECT * FROM h2o_quality LIMIT 10
{"results":[{"series":[{"name":"h2o_quality","columns":["time","index","location","randtag"],"values":[["2015-08-18T00:00:00Z",41,"coyote_creek","1"],["2015-08-18T00:00:00Z",99,"santa_monica","2"],["2015-08-18T00:06:00Z",11,"coyote_creek","3"],["2015-08-18T00:06:00Z",56,"santa_monica","2"],["2015-08-18T00:12:00Z",38,"coyote_creek","1"],["2015-08-18T00:12:00Z",65,"santa_monica","3"],["2015-08-18T00:18:00Z",50,"coyote_creek","1"],["2015-08-18T00:18:00Z",57,"santa_monica","3"],["2015-08-18T00:24:00Z",35,"coyote_creek","3"],["2015-08-18T00:24:00Z",8,"santa_monica","3"]]}]}]}
Changes the data output format - which can make it immediately useful for other software. It can also output as CSV.
> pretty
Pretty print enabled
> SELECT * FROM h2o_quality LIMIT 10
{
    "results": [
        {
            "series": [
                {
                    "name": "h2o_quality",
                    "columns": [
                        "time",
                        "index",
                        "location",
                        "randtag"
                    ],
                    "values": [
                        [
                            "2015-08-18T00:00:00Z",
                            41,
                            "coyote_creek",
                            "1"
                        ],
...
Pretty-printed JSON is easier to read.
> format csv
> SELECT * FROM h2o_quality LIMIT 10
name,time,index,location,randtag
h2o_quality,2015-08-18T00:00:00Z,41,coyote_creek,1
h2o_quality,2015-08-18T00:00:00Z,99,santa_monica,2
h2o_quality,2015-08-18T00:06:00Z,11,coyote_creek,3
h2o_quality,2015-08-18T00:06:00Z,56,santa_monica,2
h2o_quality,2015-08-18T00:12:00Z,38,coyote_creek,1
h2o_quality,2015-08-18T00:12:00Z,65,santa_monica,3
h2o_quality,2015-08-18T00:18:00Z,50,coyote_creek,1
h2o_quality,2015-08-18T00:18:00Z,57,santa_monica,3
h2o_quality,2015-08-18T00:24:00Z,35,coyote_creek,3
h2o_quality,2015-08-18T00:24:00Z,8,santa_monica,3
Here's the CSV format.
$ docker run --rm --link=quizzical_keller -v `pwd`:/data -it influxdb influx -host quizzical_keller -format csv -execute 'SELECT * FROM h2o_quality LIMIT 10' -database NOAA_watedatabase
name,time,index,location,randtag
h2o_quality,1439856000000000000,41,coyote_creek,1
h2o_quality,1439856000000000000,99,santa_monica,2
h2o_quality,1439856360000000000,11,coyote_creek,3
h2o_quality,1439856360000000000,56,santa_monica,2
h2o_quality,1439856720000000000,38,coyote_creek,1
h2o_quality,1439856720000000000,65,santa_monica,3
h2o_quality,1439857080000000000,50,coyote_creek,1
h2o_quality,1439857080000000000,57,santa_monica,3
h2o_quality,1439857440000000000,35,coyote_creek,3
h2o_quality,1439857440000000000,8,santa_monica,3
You can specify all that from the command-line tool. This obviously could be directly piped to another program, saved in a file, etc.
$ docker run --rm --link=quizzical_keller -v `pwd`:/data -it influxdb influx -host quizzical_keller
Connected to http://quizzical_keller:8086 version 1.2.4
InfluxDB shell version: 1.2.4
>
>
>
>
> show databases
name: databases
name
----
_internal
NOAA_water_database
> use NOAA_water_database
Using database NOAA_water_database
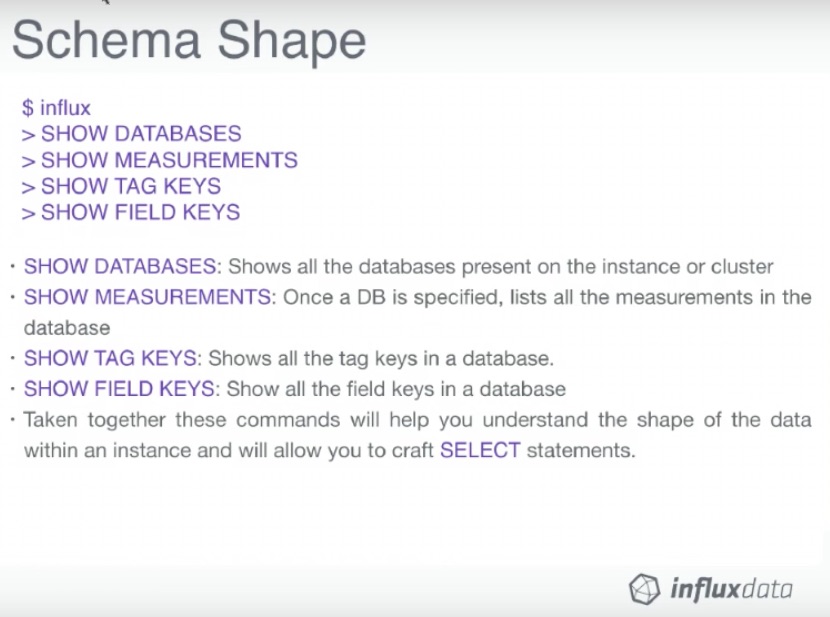
> show measurements
name: measurements
name
----
average_temperature
h2o_feet
h2o_pH
h2o_quality
h2o_temperature
> show tag keys
name: average_temperature
tagKey
------
location
name: h2o_feet
tagKey
------
location
name: h2o_pH
tagKey
------
location
name: h2o_quality
tagKey
------
location
randtag
name: h2o_temperature
tagKey
------
location
> show field keys
name: average_temperature
fieldKey fieldType
-------- ---------
degrees float
name: h2o_feet
fieldKey fieldType
-------- ---------
level description string
water_level float
name: h2o_pH
fieldKey fieldType
-------- ---------
pH float
name: h2o_quality
fieldKey fieldType
-------- ---------
index float
name: h2o_temperature
fieldKey fieldType
-------- ---------
degrees float
>

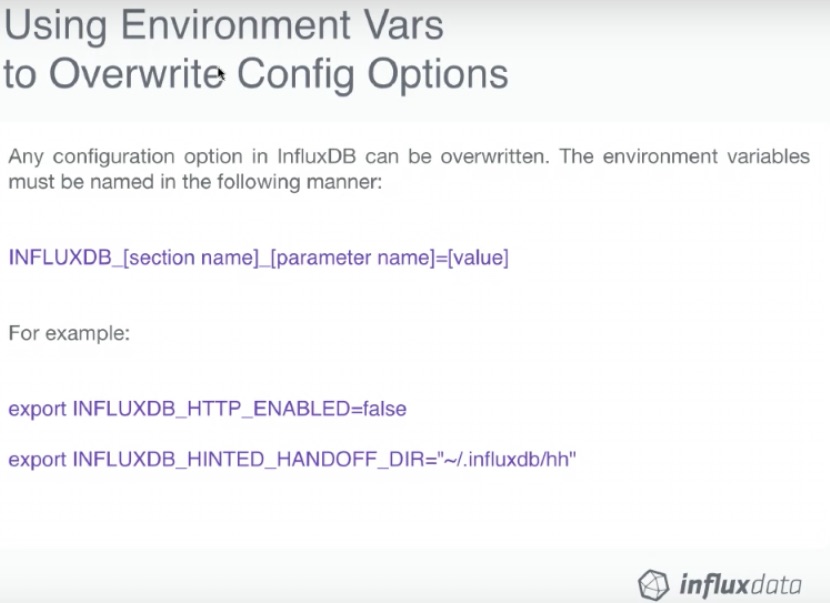
Configuration
We use this Docker command to generate the configuration file:
$ docker run --rm influxdb influxd config > influxdb.conf
Then we can edit that file and mount it inside the container as so:
$ docker run -p 8086:8086 \
      -v $PWD/influxdb.conf:/etc/influxdb/influxdb.conf:ro \
      influxdb -config /etc/influxdb/influxdb.conf
The video has a walk-through of the configuration file.